Subject of study: bus routes in “Ordzhonikidzevsky” district, city of Kharkiv
Goal of work: improvement of management of passenger traffic by bus routes in “Ordzhonikidzevsky” district, city of Kharkiv
Method of study: analytical, table-calculated method
Results obtained: basing on the existing network, a new transport network has been developed, it has been suggested that route No. 16e be provided with transport facilities, having rational passenger capacity, and with new models Bogdan А09202О and BAZ А079.04. The effectiveness of project solutions has been assessed. This graduation paper project assumes that both net reduced incomes (NRI) > 0; in this case NRIBogdan А09202= UAH 602354, while NRIBAZ А079.04= UAH 59981. The pay-off period for project Bogdan А09202 is 3.2 years, while that for project BAZ А079.04 is 3.9 years. The above data show that the project, involving the use of vehicle Bogdan А09202 is more gainful. The drivers’ operation schedule and timetable of transport facility traffic along the route have been developed, there has been calculated the effective level for installation of shock-proof components to improve the effect of driver’s seat vibration insulation.
Recommendations as to implementation of results: the study results can be applied to bus route No. 16e.
TRANSPORT FACILITY, PASSENGER, PASSENGER STREAM, ROUTE NETWORK, TRANSPORT AREA, ROUTE
Under the market relationship conditions that have taken shape on the Ukrainian market of municipal passenger traffic transport enterprises have to operate in a highly competitive environment of a great number of large-, medium- and small-scale companies. The urban transport market relations call for rising the levels of transport service competitive power at the expense of improvement of passenger traffic management methods.
The present-day approaches to the analysis of effective usage of available transport facilities and the development of prospective renovation methods, which are adopted in the course of passenger traffic management, base, as a rule, on the interests of transport enterprises, without consideration of passengers’ requirements and specifics of market relations. However, the route operation conditions, model, date of issue, number of transport facilities are known to have impartial effects on passengers’ functional condition and, depending upon the travel conditions, on a level of fatigue, which affects passenger’s ability to work. Under such conditions it is deemed important that such passenger traffic methods be applied, which would ensure the minimum passengers’ transport fatigue affecting economic and social aspects of passengers’ life activity.
Maintenance of such conditions would contribute, in a certain degree, to attainment of the principal goal of enterprise operation, that is gaining the maximum profit under conditions of the most effective and high-quality passengers’ servicing.
Defined below are the object, subject and goal of the work.
Object: passenger traffic management in “Dzerzhynsky” district, city of Kharkiv
Subject: parameters of operation of municipal passenger transport in “Dzerzhynsky” district, city of Kharkiv
Goal of work: improvement of passenger traffic management in “Dzerzhynsky” district, city of Kharkiv (in bus route No. 88e)
CHAPTER 1
ANALYSIS OF CURRENT STATUS OF PASSENGER TRAFFIC SYSTEM
1.1 Analysis of System Performance Conventional Methods
1.2 Passenger Traffic Processes
1.3 Characteristics of Kharkiv “Dzerzhynsky” District
“Dzerzhynsky” district is the second-large district of the 9 Kharkiv districts, which occupies the northwest part of the city. This administrative area is bounded, on the one side, by Sumskaya St., Bilgorod highway, and, on the other side, by Lopan’ river. This district covers a better part of the city center, residential communities of Pavlovo Pole, Shatylivka, Oleksiivka.
The district area is 62.0 thousand m2, where 22 % of the area is occupied by the residential communities and settlements [9]. As of July 01, 2006, the population size is 223.4 thousand people, which makes 15.0 % of the total population in the city of Kharkiv. As far as the size of population is concerned, the “Dzerzhynsky” district is the second-large Kharkiv district, immediately following the “Moskovsky” district. The density of population in the district is 4909 people per 1 km2. The district housing system consists of 1055 residential houses to the total area of 3973.0 thousand m2.
1.3.1 Analysis of Passenger Traffic in Kharkiv “Dzerzhynsky” District
The “Dzerzhynsky” district is serviced by municipal passenger transport of different types: buses, trolleybuses, tramcars and underground railway (metro). Routes: trolleybuses No. 18, No. 38, No. 40 and bus routes No. 20е/т, No. 45е, No. 76е, No. 77е, No. 78е, No. 217е, No. 245е, No. 283е, No. 296е service the “Dzerzhynsky” district, its limits not being exceeded.
Figure 1.2 illustrates the routes of municipal passenger transport (MPT), which pass through the “Dzerzhynsky” district.
Table 1.1 shows the routes crossing the area of Kharkiv “Dzerzhynsky” district. Their description covers the route terminal stop stations, transport communication areas, route lengths.
The “Dzerzhynsky” district is serviced by the underground railway, which carries the greatest number of Kharkiv passengers.
Today, the Kharkiv metro consists of the 3 independent lines, having the operational length of above 38.8 km, 29 stations with three transfer stations, including the following lines [11]:
Line 1 : “Kholodnogirska-Zavodska” line – 17.3 km (13 stations);
Line 2 : “Saltivska” line – 10.4 km (8 stations);
Line 3 : “Oleksiivska” line – 11.17 km (8 stations)
Figure 1.1. “Dzerzhynsky” district map showing MPT routes
1.3.2 Characteristics of Route No. 88е “Peremogy” Ave. (Tramcar Terminal Stop) – “Konstytutsii” Sq.
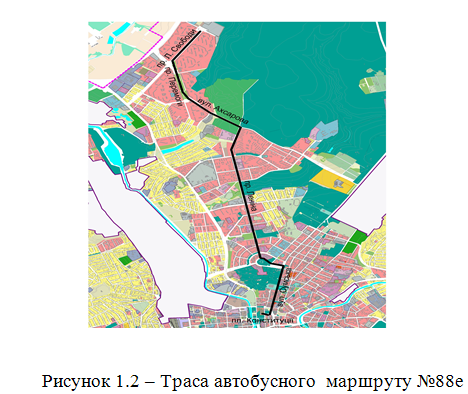
Route No. 88е connects “Oleksiivka”, the city bedroom community, with the Kharkiv central part, passing near the following metro stations: “Radianska”, “Istorychny Muzei”, “Universytet”, “Derzhprom”, “Naukova”, “Botanichny Sad”, “23 Serpnia”, “Oleksiivska” (Figure 1.2).
Line of traffic in forward direction: “Peremogy” Ave. (tramcar terminal stop), “Peremogy” Ave., “Liudviga Svobody” Ave., “Akhsarova” St., “Lenina” Ave., “Svobody” Sq., “Sumska” St., “Konstytutsii” Sq.; in reverse direction: “Konstytutsii” Sq. – “Peremogy” Ave. (tramcar terminal stop) (Figure 1.1). The length of bus route No. 88е is 9.72 km. The route passes by the following metro stations: “Radianska”, “Istorychny Muzei”, “Universytet”, “Derzhprom”, “Naukova”, “Botanichny Sad”, “23 Serpnia”, “Oleksiivska”. Operating hours: from 06-00 to 24-00. Cost of travel: UAH 3.00
Figure 1.2. Line of bus route No. 88e
1.4 Conclusions to Chapter
1. The description has been given of the “Dzerzhynsky” district, which is one of the largest districts in Kharkiv. The critical district areas have been identified, the district transport network has been analyzed.
2. The “Dzerzhynsky” district is serviced by urban passenger transport of different types: buses, trolleybuses, tramcars, and underground railway. This particular area has been analyzed to discover a great number of transport links.
3. The condition of transport facilities in route No. 88е does not meet the requirements to comfort and service life, as stipulated by Article 44 of Law of Ukraine “Motor Transport”.
CHAPTER 2
DEVELOPMENT OF PASSENGER TRAFFIC SYSTEM
2.1 Zoning
To set the limits of each transport area, the following zoning rules should be defined [3-7]:
1) rivers, railway tracks, ravines, and other natural obstacles, as well as the limits of different districts in the oblast serve as natural boundaries of a transport area and should not be inside it;
2) large-size sites that absorb passengers (stations for all transport types, large transfer stations), including all adjacent territories, should be singled out as separate transport areas;
3) transport area bounds should not pass along large main lines and should cross them at the right angle;
4) transport area bounds should not be close to a stop station, hving a high rate of passenger exchange;
5) all terminal zones of the transport network, including all adjacent territories shall be singled out as separate transport areas;
6) not more than one intersection point of main traffic lines should be within one transport area;
7) the terminal zone end point should be taken as the center in transport areas, having transport line intersection junction;
8) if possible, the transport area centers should be equally spaced from bounds between transport areas, not only in respect of distance but also with the consideration of the arrival time and convenience factors;
9) taken as the center of the transport area is one of the stops within its limits, having the largest exchange of passengers; if a settlement are is available, it is treated as the center of the transport area.
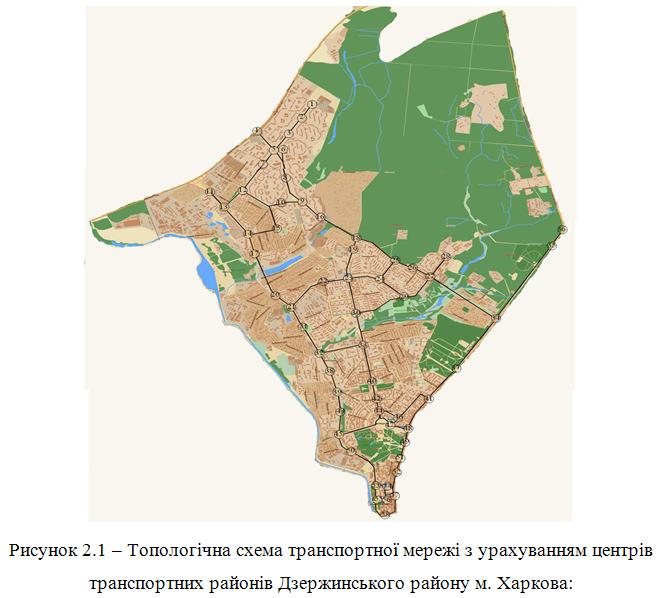
Grounding on the existing stop stations, the limits of residential communities can be set. The areal map is used to perform the zoning work (Figure 2.1).
2.2 Characteristics of Existing Route Network in “Dzerzhynsky” District, City of Kharkiv
The route network presents a configuration of routed transport bus lines (bus, trolleybus, tramcar, metro, etc.), which is shown on a city map. The All those lines are configured to form the complex transport network of the city.
Figure 2.2 presents the route network layout chart.
Table 2.1 provides characteristics of transport network links and number of lanes in each link.
Figure 2.1. Transport network layout chart with consideration of centers of transport areas in “Dzerzhynsky” district, city of Kharkiv:
1-2 transport network arcs;
1, 2 – transport area center, transport junction.
Figure 2.2. Layout chart of transport network in Kharkiv “Dzerzhynsky” district
1-2 – transport network arcs; 1, 2 – transport area center, transport junction; 88e – bus routes;
38 – trolleybus routes;20 – tramcar routes
2.3 Passenger Stream Analyses
2.3.1. Methods for Analyzing Passenger Streams
The direction, distribution over the area being serviced, and passenger streams are the key factors of route network generation.
A passenger stream should be understood as a number of passengers who pass, over a certain interval of time, through a specific run of the transport network in a populated area, in one direction. Only if the data on passenger stream amount, direction and territorial distribution are available, one can choose route lines, select transport and rolling stock types, as well as assess the quantity of transport facilities. In the course of passenger traffic management a very important part is played by irregularity of passenger stream distribution in time and in some operating route zones [3-8].
2.3.2 Assessment of Passenger Exchange Processes at Stop Stations
To assess the rate of passenger exchange at stop stations within the route network, it is found advisable that the tabular investigation method be used. As compared to other methods, this particular method is proved to be the least time-consuming and the most efficient one.
The investigation was carried out in the morning rush-hour (7:00 – 8:00). The tallymen settled at the route network stops to count passengers entering transport facilities and leaving them.
2.4 Carriage Routing
Routing is one of the most important methods to improve the passenger traffic system. The route network can be developed with the use of software facilities applied by the Transport System and Logistics Department. The capacities of transport areas and distances between transport network junctions should be used as the source calculation data.
All calculation results can be used for the purposes of prior estimation of the route network, while the final conclusions as to the route network pattern should involve the use of analytical methods, basing on the analyses of the existing route network.
In the course of routing all correspondence calculation should be based on the assumption of full balancing of labor relationship, i.e. be applied to “closed” areas where the sum of residential capacities in departure areas is exactly equal to the sum of labor capacities in arrival areas.
Figure 2.3. Reconstruction Route Network Pattern in “Dzerzhynsky” District, City of Kharkiv
2.5 Stop Stations
As concerns the rules for arranging and furnishing stops of municipal electric and motor transport [12], neither stop station of bus route No. 88e conforms to the requirements. Among the major nonconformities are inconsistency of overall dimensions of stop stations with standard requirements [12], improper maintenance of stop stations.
2.6 Selection of Type and Model of Transport Facility
2.6.1 Route Operating Characteristics
2.6.2 Calculation of Project Implementation Cost
2.6.2.1 Project Capital Costs
Taking into account that the leasing terms are much less rigorous as regards the security aspect than the financial credit terms, this paper gives consideration to the option of investment project financing through leasing. The terms of leasing provide for transfer of buses to a lease holder only after the payment for the buses, as well as to the lessor is made in the full volume (financial leasing). The leasing contract validity period matches the investment project fulfillment time. Proceeding from the above provisions, the amount of capital investments to be made in the rolling stock is recognized as the value of the initial contribution under the lease contract and cost of lease contract preparation and delivery of motor vehicles.
2.6.2.2 Current Production Costs
2.6.2.3 Loan Capital Payment
2.6.2.4 Main Taxes and Dues
For the purposes of this graduation paper project, taxes and dues of all types are classified into the main taxes and dues (value-added tax (VAT), road construction and maintenance tax (RCMT) and profit tax (PT) and additional taxes, for example, municipal taxes. This subchapter designates the method of main tax calculation. All additional taxes and dues are covered by the total amount of general economic costs.
2.6.3 Evaluation of Discount Rate
Currently, the process of discount rate evaluation is not formalized in full measure. Such a situation is attributed to diverse attitudes of investment business entities to certain aspects of investment projects. As far as the discount rate general nature is concerned, it is expected to consider simultaneously various aspects of the project under analysis, such as the project implementation time, investment risk degree, investment liquidity level at various stages of project development, investment attractiveness of industry and region where the project is to be implemented, investment capital components, consistency of the investment project lines with investor’s core business, etc.
It’s quite natural that diverse attitudes displayed by potential investors to similar factors will result in diverse discount rates. However, at all events, there must be provided the discount rate base value, grounding on which the discount rate specific size would be chosen in respect of the project under study.
Pursuant to this graduation project, the method is applied for discount rate evaluation on the basis of the “mean barrier rate”. In this case, the weighted mean cost of investment project capital is taken as the discount rate base value.
2.6.4 Calculation of Project Estimation Figures
To calculate estimation figures of the investment project, its two main characteristics must first be determined: money flow and volume of investment methods. The above figures are calculated for period t, basing on the investment flow value.
2.6.5 Calculation of Net Reduced Income
The net reduced income is the principal estimation parameter of the investment project and represents the final result of its implementation. This value is calculated as the difference between the money flow reduced to current cost and reduced project implementation cost.
2.6.6 Calculation of Profitability Index
Profitability indices are used for the purpose of repayment of projects that involve diverse investment volumes.
2.6.7 Pay-off Period
The pay-off period gives characteristic of the use of investment funds in time. This parameter indicates the period of time, which the investor needs to recover invested funds with the consideration of changes in their value in time.
2.7 Management of Drivers’ Work
Semi-graphical calculation should be made in respect of route No. 30.
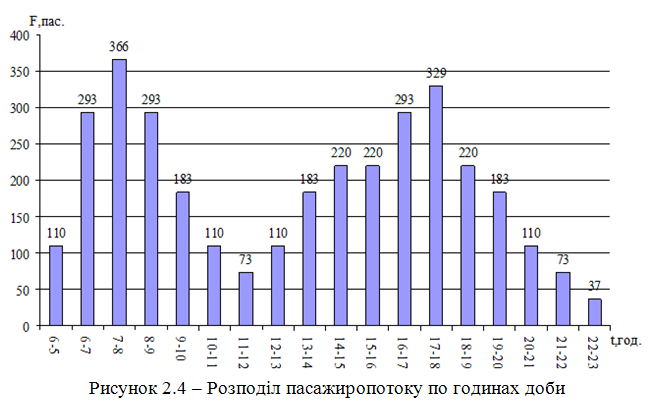
Basing on the data obtained (Table 2.10), the graph for passenger stream distribution in day hours will be plotted (Figure 2.4).
Figure 2.4. Passenger stream distribution in day hours
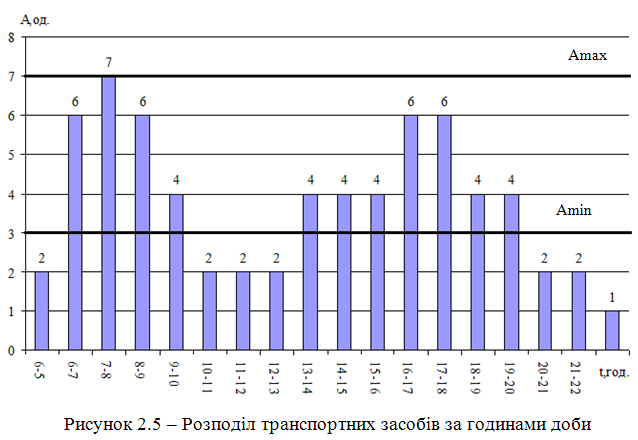
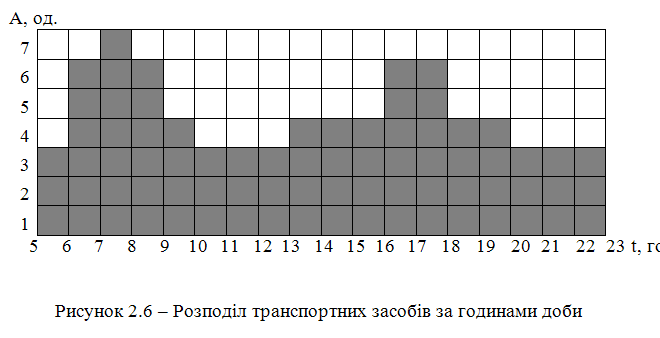
Basing on the data obtained (Table 2.13), the graph for rolling stock distribution in day hours will be plotted (Figure 2.5).
Calculation of the minimum necessary number is based on the sssumption that the bus waiting time at the stop station should not exceed 20 minutes.
Figure 2.5. Distribution of transport facilities in day hours
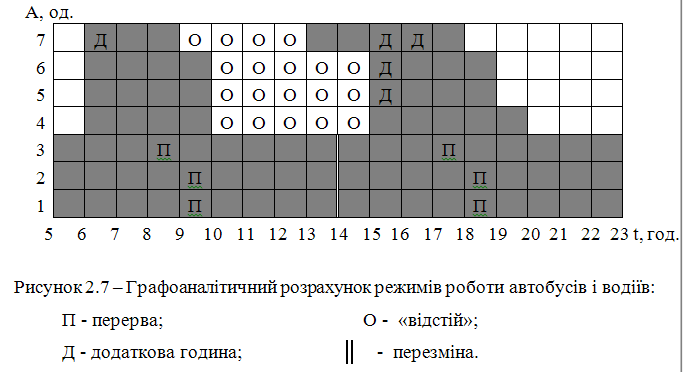
The graph, showing the modes of drivers’ and bus operation is plotted. Under two-shift conditions one bus is shared by two drivers. One of the drivers starts working on the route, works for certain time, then is replaced by the other driver at the terminal stop, who continues working until the route functioning time is over. In case of mode interruption it is assumed that the bus is driven by one driver who enjoys the so called “idle time” during the period between rush-hours. The main idea of this structure is as described below. Squares shown in diagram А — Т (Figure 2.6) are shifted along the vertical line, thus providing for operation of buses and drivers in conformity with the conditions described below: service time per one driver for buses operating in the two-shift mode must be 9 hours. > tp > 7 h., lunch hour: 0.5 h. > tn > 1.5 h.; time of service per one driver for buses operating in the interrupted mode must be 10 h. >tp>8 h., “idle time”: 5 h. >tп>3 h.; time of continuous driver’s work without break or before arranging for “idle time” should not exceed 5 hours.
To satisfy every condition, bus-hours can be added, which are designated in the diagram as letter «Д» (additional hour). The quantity of such hours is restricted by the value of graph-analytical structure coefficient.
Since the condition is satisfied, such a calculation can also be recognized as satisfactory. Figure 2.7 below represents the results of the graph-analytical calculation of bus and drivers’ operating modes.
Figure 2.6. Distribution of transport facilities in day hours
Figure 2.7. Graph-analytical calculation of bus and drivers’ operating modes:
П – break; Д – additional hour; O – idle time; || – shift change
According to the calculation results, releases 1-3 operate under two-shift conditions, while releases 4-7 operate under interrupted conditions.
2.8 Traffic Schedule
Basing on the graph-analytical calculation results, traffic intervals in day hours can be determined:
Table 2.24. Bus traffic intervals in day hours
|
Day hour |
5-6 |
6-7 |
7-8 |
8-9 |
9-10 |
10-11 |
11-12 |
12-13 |
13-14 |
|
I , unit |
19 |
8 |
8 |
10 |
15 |
19 |
19 |
19 |
15 |
|
Day hour |
14-15 |
15-16 |
16-17 |
17-18 |
18-19 |
19-20 |
20-21 |
21-22 |
22-23 |
|
I , unit |
15 |
8 |
8 |
10 |
15 |
15 |
19 |
19 |
19 |
The graph-analytical calculation data allow to set the starting and finishing hours of operation of a particular release within the time of one hour. Apparently, all the buses may not enter and leave the route without any system. To arrange for a specific mode of route bus traffic, a schedule should be drawn up.
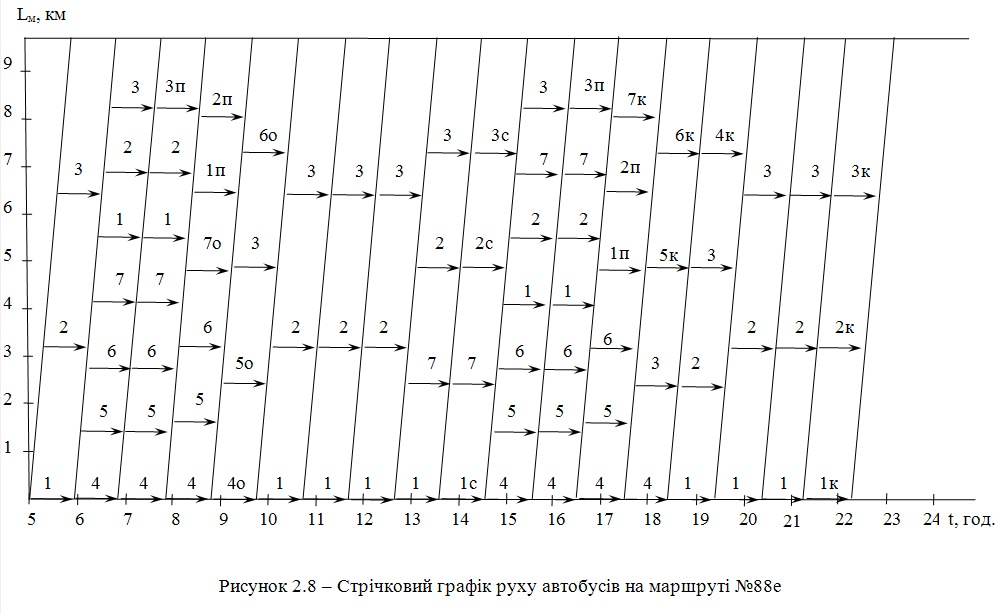
The “strip” method developed by the Motor Transport Research Institute (NIIAT) is the most common method. Using this method, the current time is set in the X-axis with the indication of segments being equal to turn-round hours. Laid in the Y-axis is a physically dimensionless segment, with its value being equal to the turn-round rime segment. The start point of the first turn-round in the X-axis bottom line is connected with the end point of the first turn-round in the top line running parallel to the X-axis. This line separates a finite number of same-length segments, which equals the number of buses on the route at the time. Next similar segment is split into component elementary segments, which number matches the number of mobile units at this time. Beams running parallel to the X-axis and originating at the ends of elementary segments imitate motion of the bus of a particular release.
Using this method to model graphically bus traffic, the whole route can be easily described with the consideration of bus breaks, idle time and fuelling time. In order to determine specific time, at which a particular release leaves the terminal stop station, it would suffice to drop a perpendicular on the X-axis from the point of intersection of the slant curve and proper release beam.
To construct a graph, it should be taken into account that operation of the first bus release is started (Figure 2.8).
Figure 2.8. Strip schedule of traffic of route bus No. 88e
Table 2.25. Schedule of traffic of releases on route No. 88е
|
1 випуск |
Release 2 |
Release 3 |
Release 4 |
Release 5 |
Release 6 |
Release 7 |
|||||||
|
КО1 |
КО2 |
КО1 |
КО2 |
КО1 |
КО2 |
КО1 |
КО2 |
КО1 |
КО2 |
КО1 |
КО2 |
КО1 |
КО2 |
|
5:00 |
5:29 |
5:19 |
5:48 |
5:38 |
6:07 |
5:58 |
6:27 |
6:06 |
6:35 |
6:14 |
6:43 |
6:22 |
6:51 |
|
6:30 |
6:59 |
6:38 |
7:07 |
6:46 |
7:15 |
6:56 |
7:25 |
7:04 |
7:33 |
7:12 |
7:41 |
7:20 |
7:49 |
|
7:28 |
7:57 |
7:36 |
8:05 |
7:44 |
П |
7:54 |
8:23 |
8:03 |
8:32 |
8:13 |
8:42 |
8:22 |
О |
|
8:32 |
О |
8:41 |
О |
9:21 |
9:50 |
8:52 |
О |
9:06 |
О |
9:35 |
О |
12:58 |
13:27 |
|
9:50 |
10:19 |
10:09 |
10:38 |
10:28 |
10:57 |
14:40 |
15:09 |
14:48 |
15:17 |
14:56 |
15:25 |
13:56 |
14:25 |
|
10:48 |
11:17 |
11:07 |
11:36 |
11:26 |
11:55 |
15:38 |
16:07 |
15:46 |
16:15 |
15:54 |
16:23 |
15:20 |
15:49 |
|
11:46 |
12:15 |
12:05 |
12:34 |
12:24 |
12:53 |
16:36 |
17:05 |
16:45 |
17:14 |
16:55 |
17:24 |
16:18 |
16:47 |
|
12:44 |
13:13 |
13:13 |
13:42 |
13:27 |
13:56 |
17:34 |
18:03 |
18:04 |
К |
18:18 |
К |
17:23 |
К |
|
13:42 |
С |
14:11 |
С |
14:25 |
С |
19:15 |
К |
||||||
|
15:04 |
15:33 |
15:12 |
15:41 |
15:28 |
15:57 |
||||||||
|
16:02 |
16:31 |
16:10 |
16:39 |
16:26 |
П |
||||||||
|
17:04 |
П |
17:14 |
П |
17:49 |
18:18 |
||||||||
|
18:32 |
19:01 |
18:46 |
19:15 |
19:01 |
19:30 |
||||||||
|
19:30 |
19:59 |
19:49 |
20:18 |
20:08 |
20:37 |
||||||||
|
20:28 |
20:57 |
20:47 |
21:16 |
21:06 |
21:35 |
||||||||
|
21:26 |
К |
21:45 |
К |
22:04 |
К |
||||||||
Table 2.26. Bus departure and arrival time
|
№ of release |
Departure time |
Arrival time |
|
1 |
4:50 |
22:24 |
|
2 |
5:09 |
22:43 |
|
3 |
5:28 |
23:02 |
|
4 |
5:58 |
20:13 |
|
5 |
6:06 |
19:01 |
|
6 |
6:14 |
19:15 |
|
7 |
6:22 |
18:21 |
Table 2.27 – Number of turn-rounds, break time and idle time
|
Number of release |
1 |
2 |
3 |
4 |
5 |
6 |
7 |
|
|
Number of turn-rounds |
1st shift (before idle time) |
8 |
8 |
8 |
4 |
4 |
4 |
3 |
|
2nd shift (after idle time) |
8 |
8 |
8 |
5 |
4 |
4 |
5 |
|
|
Break time (idle time) ,h |
1:00 |
1:04 |
1:04 |
4:50 |
4:44 |
4:23 |
3:38 |
|
|
Duty time, Тні, h |
16:24 |
16:20 |
16:20 |
9:25 |
8:12 |
8:39 |
8:21 |
|
2.7 Conclusions
1. Passenger traffic routing operation was performed. Basing on the existing transport network, the new network was developed.
2. To improve quality of passenger traffic in bus route No. 88е, introduction of new transport facilities of rational passenger capacity was proposed.
3. Model “Ruslan A-103” is chosen for route operation during the pay-off period.
4. The drivers’ work schedule and transport facility route traffic schedule were developed.
CHAPTER 3
LABOR PROTECTION AND SAFETY IN EMERGENCY SITUATIONS
3.1 Security of Labor Protection and Safety in Emergency Situations on Legislative Level
Labor protection is a system of legal, social-and-economic, organizational-and-technical, hygiene-and-sanitary and medical-and-preventive measures and methods aimed at preservation of life, health і working ability of people in the course of their work.
3.2 Analysis of Conditions and Identification of Potential Hazards in Routes of Municipal Passenger Transport
3.3 Development of Organizational Measures Focused on Improvement of Conditions of Work in Routes of Municipal Passenger Transport
3.3.1 Preparation of Transport Facility for Line Operation
Prior to enter the line, the municipal passenger transport facilities (that is buses) shall be tested for proper technical condition. Following verification of bus technical condition, the person in charge of bus release, should make an appropriate entry in the route sheet to prove that the transport facility is ready for operation. It is strictly forbidden that motor vehicles having defects endangering traffic safety and passengers’ life should be released to the line [15].
3.3.2 Line Operation of Traffic Facility
In the course of bus line operation is strictly prohibited that a driver drive a motor vehicle under condition of even minor alcoholic intoxication, or under the effects of drugs, deviate from the route specified in the route sheet without permission, unless any such deviation is due to deterioration of traffic or climatic conditions.
3.4 Development of Technical Measures to Improve Conditions of Work in Routes of Municipal Passenger Transport
3.4.1 Requirements to Driver’s Work Position
Operation of a transport facility in city routes can be rated as one of the most intense and exhausting forms of work. This work is done under conditions of permanent and considerable nervous and emotional tension, which is still further increased by comprehension of great responsibility for human life and material values. Speed of response and precision of operational movements of a modern-vehicle driver are the most important factors of traffic safety. The above properties depend, to a large degree, on the convenience of driver’s work position, which must provide for favorable work conditions and eliminate the risk of accidents caused by overstrain of a driver at work.
3.4.2. Vibration Insulation of Driver’s Seat in Transport Facility
Passive vibration insulation (vibration protection) is vibration insulation that does not use energy from an extra source.
The driver’s seat must provide for hygienic-and-sanitary conditions to ensure continuous drivers’ work. The seat must damp jolts, shocks and a part of vibration, which are not consistent with hygienic characteristics and exceed the vibration normal values.
With the consideration of the fact that operator’s fatigability much depends upon the work position, it was proved in the course of study that the seat must be adjustable, soft and spring-loaded. The horizontal, longitudinal displacement should be at least 150 mm, vertical displacement – at least 80 mm, back vertical displacement – at least 60 mm, while the back inclination angle – at least 10 degrees.
3.5 Methods Applied to Prevent Emergency Situations and Eliminate their Consequences in Routes of Municipal Passenger Transport
3.5.1 Identification of Potentially Hazardous Facilities
Any motor transport enterprise engaged in operation of transport vehicles and having a fuel-filling station within its territory should be rated as potentially hazardous facility.
The system of identification of potentially hazardous facilities [13] provides for the integrated procedure of identification of potentially hazardous facilities (hereinafter referred to as the “identification”) with a view to improving management of its state record-keeping in the process of certification and registration in the State Register of Potentially Hazardous Facilities.
3.5.2 Fire Safety in Sphere of Motor Transport
Fire safety is the facility condition, under which any risk of fire is made impossible and, in case of fire, its hazardous effects on people are prevented, and protection of material values is guaranteed [18].
3.6 Conclusions
Chapter “Labor Protection and Safety in Emergency Situations” was addressed to consideration of the following aspects:
– assurance of labor protection and safety on the legislative level;
| – analysis of work conditions and identification of potential hazards at facility under study; |
| – development of organizational measures to be taken to improve conditions of work at facility under study; safety requirements applicable to operation of transport facilities; |
| – safety requirements to technical condition and equipment of transport facilities;- development of technical measures to improve conditions of work at facility under study;- requirements to microclimate and air in operational zone;- requirements to noise level;- methods for calculation of driver’s seat vibration insulation; |
– methods to be applied for the purpose of prevention and liquidation of consequences of emergency situations at facility under study.
CHAPTER 4
ASSESSMENT OF EFFECTIVENESS OF PROJECT SOLUTIONS
In the course of improvement of the system of passenger traffic management in the Dzerzhynsky district, city of Kharkiv, the changes were introduced to bus route No. 88e as a result of changing the parameters of the existing route network, which enabled to reduce the traffic interval and waiting time in the route.
4.1 Estimation of Efficiency of Investment Project
It is proposed that the route transport facilities be renovated by way of investment planning. The transport facility models proposed for operation in the route are PAZ 32-04 and Ruslan А-103.
When assessing the investment project, the relative efficiency of investments is described, to the most considerable degree, by the profitability index (PI). Under conditions of more than one investment proposal and limited volume of investment resources the best combination of available investment projects is the one providing for the maximum net reduced income being in total in respect of all projects. Therefore, the PI value must be taken into account when drawing conclusions as to a degree of project effectiveness.
For the investment projects under study, PIPAZ 32-04=3.82, PIRuslan А-103=12.07, which is indicative of the investment attractiveness of the project for furnishing transport facilities with new Ruslan A-103 models.
The pay-off period and internal profitability norm are the indices, which supplement the PI index, since they characterize the diverse aspects of utilization of investment funds.
For the investment projects under study, PPPAZ 32-04=3.1, PPRuslan А-103=1.7, which is indicative of the investment advantage of the project for furnishing transport facilities with new Ruslan A-103 models.
The pay-off period can appear important for a potential investor as a criterion index, if available funds are planned to be used in other investment projects in near future.
The internal profitability norm (IPN) is a rather important estimation index, since it does not cover the discount rate in the process of calculations. This index can be used as the criterion index, provided the minimum permissible value of the internal profitability norm is set in respect of a potential investor.
For the investment projects under study, IPNPAZ 32-04=42.9, IPNRuslan А-103=138.1, which is indicative of a higher prospectivity of the project for furnishing transport facilities with new models Ruslan А-103.
However, one should take into account that the value of internal profitability norm is materially influenced by the period of project effective implementation; the longer is the period, the higher is the value of internal profitability norm.
The analysis that has been conducted demonstrates investment attractiveness and economic efficiency of the project for furnishing route transport facilities with new models Ruslan A-103.
4.2 Estimation of Effectiveness of Organizational Measures Taken to Improve Conditions of Work in Municipal Passenger Transport Routes
The driver’s work conditions have an impact on a degree of driver’s fatigue, concentration and attention. Improvement of vibration insulation properties of a driver’s seat presents one of the most effective measures to reduce vibrational load on drivers. Enhancement of vibration insulation of drivers’ seats by way of installation of special damping elements would be effective on a level of 12, 14 dB.
4.3 Conclusions Applied to Chapter
1. The results of investment project comparative analyses demonstrate investment attractiveness and economic efficiency of the project for furnishing route transport facilities with new models Ruslan A-103.
2. Improvement of vibration insulation of a driver’s seat through installation of shock-absorbing elements results in a lower degree of driver’s exhaustion under route work conditions and is effective on a level of 12, 14 dB.
REFERENCES
1. I.S. Yefremov, V.M. Kobozev, V.A. Yudin. Theory of Municipal Passenger Traffic. – M.: Higher School, 1980. – 535 pages.
2. I.V. Spirin. Management and Control of Passenger Motor Traffic. – M.: Academy, 2003. – 400 pages.
3. V.K. Dolia. Passenger Traffic: Textbook. – Kharkiv: “Fort” Publishing House, 2011. – 504 pages.
4. G.A. Varelopulo. Management of Traffic and Carriage by Urban Passenger Transport. Teaching Handbook. M.: “Transport”, 1990. – 208 pages.
5. Ye.P. Volodin, N.I. Gromov. Management and Planning of Carriage by Motor Transport. – M.: “Transport”, 1982. – 224 pages.
6. I.S. Yefremov, V.M. Kobozev, V.A. Yudin. Theory of Municipal Passenger Traffic. – M.: Higher School, 1980. – 535 pages.
7. D.S. Samoilov. Municipal Transport. – M.: “Stroiizdat”, 1983. – 384 pages.
8. L.L. Afanasiiev, A.I. Vorkut. Passenger Motor Carriage. – M.: “Transport”, 1986. – 220 pages.


