The purpose of this graph-calculation paper is to choose the most attractive investment project for application of two models of transport facilities. To make a choice of the most attractive project, the calculations will be made, basing on such parameters as the value of motor vehicle utilization income, value of project implementation total cost and assessment of project effectiveness.
To assess the income value, there was calculated the number of turnovers necessary for retail network servicing, average time of turnover of transport facilities. To identify the above-mentioned parameters of operation of transport facilities, there were calculated the average monthly number of deliveries and volume of material flow in the retail network, number of route entry stations and average length of the route itself, loading time at a distribution warehouse and time of unloading retail lots of cargoes, idle time in the process of retail network servicing.
The second chapter was addressed to the analysis of project implementation costs, including capital investments during the period under review, current cost of production management during the period under review, loan capital payments during the period under review, as well as basic taxes and dues during the period under review. Besides, there was found the accounting quantity of transport facilities being necessary to meet the daily requirements in the maximum possible volume, volume of material flow between the distribution flow and retail network, maximum possible number of daily turnovers of one transport facility. Apart from it, there were calculated the indices making a part of the current costs: drivers’ wage expenses, engineers’ and technicians’ wage expenses, rolling stock maintenance and repair cost, cost of fuel consumed by internal combustion engines of transport facilities, cost of oil and lubricants, cost of motor vehicle tires, general economic expenses. Then there was assessed the volume of borrowed funds and credit-recourse interests, and their payment was distributed between different periods of the project implementation time. The conclusive part of the chapter assessed the volumes of enterprise basic taxes and depreciation cost in respect of each project implementation period. All those calculations were applied to two models of transport facilities.
The next chapter was addressed to the assessment of project effectiveness in respect of two models of transport facilities. For the purposes of further calculations, the discount rate was set, which covered the risk-free rate (i.e. the rate at which the credit was attracted), risk of liquidity of the investment medium, risk of investment management, market risk, inflation risk, financial risk, legislative risk, as well as other risks that affect, one way or another, the decision to be made by potential investors. To calculate the investment project evaluative parameters, the following project characteristics were singled out: investment flow, cash flow and volume of investment funds.
At the final stage of the work, to compare the projects, their net reduced income will be found. Besides, to supplement the profitability index, there will be determined the pay-off period, during which the investor will recover the invested funds with the consideration of changes in their value with time and internal profitability norm in respect of each project, which can be criterial, if its minimum permissible value was defined by the investor.
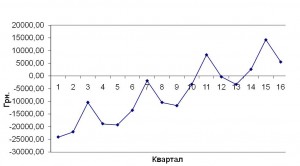
Figure 1. Quarter-wise investment flow applied to transport facility model, which is planned to be bought
Грн. – Ukrainian Hryvnias, Квартал – Quarter


